Overview: The Big Picture
Must knowThink of the circulatory system as pressurized plumbing: a pump (the heart), delivery pipes (arteries), exchange surfaces (capillaries), and return pipes (veins). The MCAT tests how basic fluid physics — pressure, flow, resistance, velocity — applies to this biological system.
Priority labels: Must know = cold; Know the logic = mechanism not names/numbers; Passage-level = recognize, don't memorize; Optional = skippable.
This is a closed, double circulation: blood stays within vessels and passes through the heart twice per full loop. Two loops in series:
- Pulmonary circulation: right heart → lungs → left heart (low-pressure, gas exchange)
- Systemic circulation: left heart → body → right heart (high-pressure, delivery)
Within either loop, blood follows the same sequence: artery → arteriole → capillary → venule → vein. By definition, arteries carry blood away from the heart and veins carry blood toward the heart — a direction-based rule, not an oxygen-based one. The exceptions prove the point: pulmonary arteries carry deoxygenated blood and pulmonary veins carry oxygenated blood. Capillaries — one cell layer thick — are the site of all gas, nutrient, and waste exchange.
Blood flows down a pressure gradient from high pressure (aorta) to low pressure (right atrium, ~0 mmHg). Everything downstream is about how that pressure is distributed and used.
Cardiac Output: The Master Variable
Must knowCardiac output (CO) is the volume pumped by one ventricle per minute: , where is heart rate and is stroke volume. Normal resting CO ≈ 5 L/min; peak exercise can reach 20–25 L/min.
Stroke volume depends on preload (ventricular stretch at end-diastole, set by venous return), afterload (arterial pressure the ventricle ejects against), and contractility (intrinsic force, increased by catecholamines).
Know the logicThe Frank-Starling mechanism: within limits, increased preload (stretch) increases stroke volume — the heart pumps out what it receives, automatically matching the two ventricles' outputs.
Quick check: If heart rate is 70 beats/min and stroke volume is 70 mL/beat, what is CO?
Answer: . Normal resting CO.
Pressure Concepts: Systolic, Diastolic, Pulse Pressure, and MAP
Blood Pressure Basics
Must knowThe heart is a pulsatile pump, so arterial pressure oscillates:
- Systolic blood pressure (SBP): peak during ventricular ejection (~120 mmHg)
- Diastolic blood pressure (DBP): minimum during relaxation (~80 mmHg)
Pulse pressure (PP) is the difference: (normally ~40 mmHg). PP increases with higher SV or decreased arterial compliance (aging/atherosclerosis — stiffer arteries can't buffer the stroke volume).
Mean Arterial Pressure
Know the logicMean arterial pressure (MAP) is the time-averaged driving pressure. Because diastole lasts longer than systole (~2/3 of the cycle at rest), MAP is weighted toward DBP — not a simple average:
For BP 120/80: — about 1/3 of the way from DBP to SBP.
Ohm's Law Analog for Circulation
Must knowSystemic flow is driven by MAP (since right-atrial pressure ≈ 0). The cardiovascular analog of Ohm's law:
where total peripheral resistance (TPR) is the summed resistance of the systemic vasculature. MAP rises with harder pumping (CO) or more constricted vessels (TPR); hypertension can arise from either.
Quick check: If CO stays constant but arterioles constrict (increasing TPR), what happens to MAP?
Answer: MAP increases — the mechanism of many forms of hypertension and the response to sympathetic stimulation.
Vascular Resistance and the Role of Radius
Know the logicResistance to flow rises steeply as a vessel narrows. For laminar flow, resistance scales with (Poiseuille relationship), so halving a vessel's radius raises its resistance ~16-fold (). This is why small changes in arteriolar diameter dominate blood flow and TPR, and why arterioles are the primary resistance vessels. (The MCAT treats this qualitatively in BIO — you are not expected to crunch numeric resistance values.)
OptionalResistance also rises with viscosity () and length. Viscosity tracks hematocrit: anemia lowers viscosity (lower resistance but reduced O₂-carrying capacity); polycythemia raises it.
Passage-levelSeries vs. parallel: organ circulations are arranged largely in parallel in the systemic circuit, so each organ receives the full MAP and flow can be regulated independently. Opening more parallel paths (capillary recruitment in exercise) lowers total resistance and boosts flow to working muscle.
The Arterial System
Structure Recap
Must know(Wall anatomy — elastin, smooth muscle, the elastic/muscular/arteriolar layering — is covered in full in the 3B Circulatory System guide.) For the physics here, the load-bearing point is functional: elastic arteries (aorta) buffer pressure via recoil, while arterioles (thick smooth muscle) set resistance.
The Windkessel Effect
Know the logicThe heart ejects in pulses. Elastin in the aortic wall lets it stretch and store energy during systole, then recoil during diastole, smoothing pulsatile flow into more continuous capillary flow. With aging/atherosclerosis the wall stiffens, this buffering fails, SBP rises and PP widens — why isolated systolic hypertension is common in the elderly.
Pressure Distribution Along the Arterial Tree
Must knowPressure is highest in the aorta and falls progressively; the largest single drop occurs across the arterioles (the resistance vessels). This drop is what drives capillary filtration.
Quick check: A patient develops atherosclerosis, causing arteriolar narrowing. How does this affect MAP, capillary pressure, and venous pressure?
Answer: Arteriolar resistance ↑ → MAP ↑ (same CO × higher TPR). Because the big pressure drop now occurs more proximally, capillary pressure may actually decrease (arterioles act as a dam). Venous pressure is largely unchanged.
The Venous System
Structure and Capacitance
Must knowVeins return blood to the heart. Their walls are thin and highly compliant (distensible), and they hold ~60–65% of total blood volume — the capacitance (reservoir) system. Compliance describes volume change per unit pressure; veins are ~20× more compliant than arteries.
Know the logicSympathetic venoconstriction reduces venous compliance, shifting blood toward the heart and raising preload — a rapid way to increase CO without changing TPR.
Venous Pressure and Return
Must knowVenous pressures are low (~15 mmHg at the venular end of capillaries, falling toward ~0 at the right atrium). The small gradient suffices because large-diameter veins have low resistance. Venous return against gravity is aided by the skeletal muscle pump (limb muscles squeeze veins, with one-way valves preventing backflow), the respiratory pump, and sympathetic venoconstriction. (See the 3B Circulatory System guide for the anatomy of venous valves and varicose veins; the physics point is that only veins carry valves — arterial pressure makes them unnecessary in arteries.)
Quick check: Why do you feel lightheaded when you stand up suddenly?
Answer: Gravity pools blood in leg veins → venous return drops → CO drops → cerebral perfusion drops briefly → lightheadedness. The baroreceptor reflex quickly raises HR and vasoconstriction to restore MAP; failure = orthostatic hypotension.
Flow Velocity, Cross-Sectional Area, and the Continuity Equation
The Continuity Equation
Must knowFor an incompressible fluid, : volumetric flow rate equals cross-sectional area times velocity. Since is conserved at steady state, velocity and total area are inversely related — wider total area means slower flow.
Velocity Across the Vascular Tree
Must knowVelocity is highest in the aorta (small total area) and slowest in the capillaries, which have the largest combined cross-sectional area (millions in parallel). The slow capillary velocity is functional: it maximizes time for diffusion of O₂, CO₂, nutrients, and waste. Velocity then rises again toward the heart as veins converge.
Quick check: The aorta has a cross-sectional area of 4 cm² and blood flows at 40 cm/s. The combined area of all capillaries is 2,000 cm². What is the mean velocity in the capillaries?
Answer: ; in capillaries . (Numbers vary by source; the method is what's tested.)
Bernoulli and Hydrostatic Effects
Passage-levelBernoulli's principle () captures energy conservation in ideal flow. Two MCAT-relevant uses:
- At a stenosis, velocity rises so lateral (static) pressure falls — contributing to turbulent sounds over narrowed vessels.
- Hydrostatic pressure () means BP is higher at the feet and lower at the brain in an upright person. Measure BP at heart level for accuracy.
Blood flow is not truly ideal (viscosity dissipates energy), so the MCAT uses Bernoulli only qualitatively.
Quick check: A student places a blood pressure cuff too high on the arm (above heart level). Will the measured BP be higher or lower than true brachial pressure?
Answer: Lower — the hydrostatic column above heart level reduces the measured pressure. Measure at heart level.
Laminar vs. Turbulent Flow
Must knowNormally blood flows in smooth concentric layers — laminar flow (fastest at the center, a parabolic profile) — which is quiet and efficient. Turbulent flow is chaotic and energy-wasting, and it makes sound. Turbulence is favored by high velocity, large diameter, and low viscosity (summarized by the Reynolds number, ; higher → turbulent).
Clinical hooks: turbulence produces murmurs (heart/abnormal valves), bruits (stenotic peripheral arteries), and Korotkoff sounds (partially occluded brachial artery — the basis of BP measurement). Anemia (low viscosity) can cause a "flow murmur" with normal anatomy.
Quick check: Why does a stenotic (narrowed) artery promote turbulence even though a narrow tube might seem to slow blood down?
Answer: At the stenosis, the continuity equation forces velocity up (small area → high velocity), raising past the turbulent threshold; eddies form just downstream, where the bruit is heard.
Capillaries and the Starling Forces
Must knowCapillary walls are one endothelial cell thick. Fluid movement is set by the balance of two opposing Starling forces:
- Hydrostatic pressure (, capillary blood pressure) pushes fluid out.
- Oncotic (colloid osmotic) pressure (), from plasma proteins (mainly albumin) that can't cross the wall, pulls fluid in.
You reason about direction qualitatively (the exact filtration-rate equation is not needed). At the arterial end, high hydrostatic pressure exceeds oncotic pressure → net filtration out. At the venous end, hydrostatic pressure has fallen below oncotic pressure → net reabsorption. The unreabsorbed remainder is returned by the lymphatic system.
Edema results from disrupting this balance: elevated capillary pressure (heart failure), low oncotic pressure (low albumin in liver disease/malnutrition), or lymphatic obstruction.
Quick check: A patient with severe liver disease cannot synthesize albumin. How does this cause edema?
Answer: Low albumin → low → net filtration exceeds reabsorption along the whole capillary → fluid accumulates in the interstitium (ascites is classic).
Blood as a Gas-Transport Fluid
Must knowBlood is the working fluid, so its composition and -carrying behavior set the boundary conditions for the flow physics above. The detailed biochemistry — blood composition, the full oxyhemoglobin dissociation curve, the Bohr effect, transport, and fetal hemoglobin — is developed in the 3B Circulatory System guide; this is the brief recap needed here.
About 45% of blood volume is red blood cells (the hematocrit, which sets viscosity — see Vascular Resistance above); the rest is plasma. Each RBC carries hemoglobin (Hb), a tetramer that binds up to four molecules.
The Oxyhemoglobin Dissociation Curve
Must knowPlotting Hb -saturation against gives a sigmoidal curve from cooperative binding: a flat plateau in the lung-range keeps Hb loaded, and a steep middle in the tissue range unloads large amounts of for a small pressure drop. P50 (~26 mmHg) indexes affinity, and a rightward Bohr shift (↑, ↑, ↑temp, ↑2,3-BPG) raises P50 to unload more in active tissue. The slow capillary velocity established by the continuity equation is what gives this unloading time to occur.
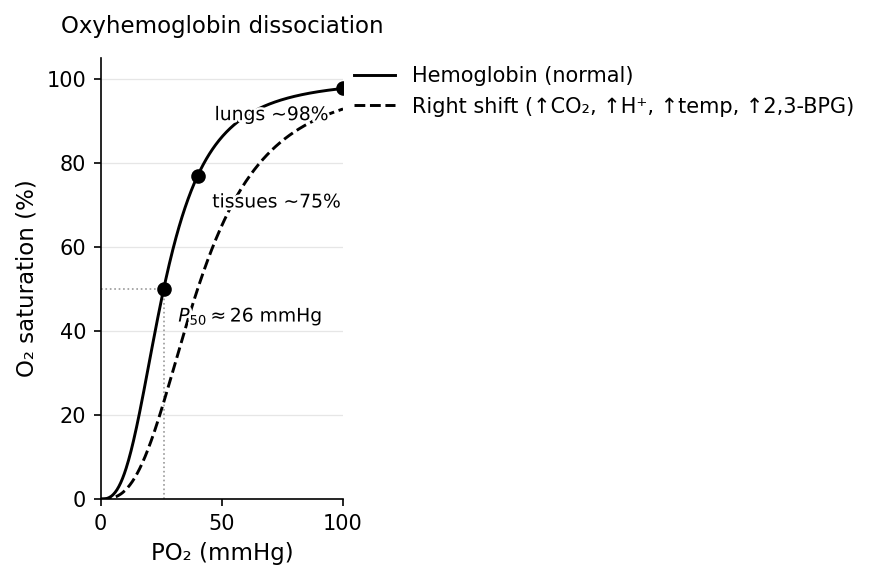
Quick check: During exercise, muscle becomes warmer, more acidic, and richer in . What happens to delivery there?
Answer: All three shift the O2–Hb curve right (Bohr effect) → affinity falls → more unloads to the working muscle, matching demand.
Autoregulation and Vascular Control
Know the logicOrgans match their own blood flow to demand — autoregulation — via two mechanisms:
- Myogenic response: rising pressure stretches arteriolar smooth muscle, which reflexively contracts to normalize flow (and vice versa).
- Metabolic regulation: local byproducts (CO₂, H⁺, adenosine, K⁺, low O₂) cause arteriolar vasodilation, increasing local flow — the dominant mechanism in exercise.
Systemic control layers on top, acting through the two physics knobs in . In brief: short-term, baroreceptors (carotid sinus, aortic arch) drive a fast brainstem reflex that adjusts HR and vessel diameter (correcting the MAP drop on standing); long-term, the renin–angiotensin–aldosterone system (RAAS) and ADH/vasopressin adjust blood volume — hence preload and CO — over hours to days. (The receptor and hormonal mechanisms behind this nervous/hormonal control are detailed in the 3B Circulatory System guide; what matters here is that both routes resolve to changing CO or TPR.)
Quick check: During exercise, local metabolic vasodilation in muscle sharply lowers TPR. If the heart didn't compensate by increasing CO, what would happen to MAP?
Answer: MAP = CO × TPR, so falling TPR with unchanged CO would drop MAP. The sympathetic system raises HR and SV (↑CO) to maintain or raise MAP during exercise.
Common Confusions & Tricks
1. Velocity vs. flow rate: Flow rate (Q) is constant throughout the circuit at steady state; velocity (v) is not. Velocity is highest in the aorta (small area) and lowest in capillaries (huge combined area). Remember .
2. MAP formula: is NOT a simple average — don't add SBP + DBP and divide by 2. The 1/3 weighting reflects the longer diastole.
3. Pressure drop location: The biggest pressure drop is across the arterioles, not capillaries or large arteries — the "resistance vessels."
4. Arteries vs. veins — which has valves? Only veins (in the limbs). On a cross-section: veins have thin walls, large/irregular lumens, and valves; arteries have thick walls, round lumens, no valves.
5. Ohm's law analog direction: . Vasoconstriction → TPR up → MAP up; vasodilation → MAP down (if CO constant).
6. Compliance asymmetry: Veins are far MORE compliant. Arteries = stiff pressure reservoir; veins = floppy volume reservoir.
7. Viscosity and hematocrit: High hematocrit (polycythemia) → ↑viscosity → ↑resistance → ↑cardiac workload. Anemia → opposite, but reduced O₂ delivery.
8. Turbulence heuristic — "if you see a bruit, think stenosis": Narrowing (plaque, stenotic valve) creates downstream turbulence from high velocity. Anemia/fever (low viscosity, high CO) can also cause turbulent murmurs with normal anatomy.
9. Starling forces edema pattern: Low albumin (liver disease, malnutrition) and elevated venous pressure (heart failure) → bilateral dependent edema; lymphatic obstruction → localized lymphedema.
10. Right vs. left heart pressures: Pulmonary circulation is low pressure (~25/10 mmHg) vs. systemic (~120/80). The right ventricle pumps the same CO against much lower resistance, so its wall is thinner; pulmonary hypertension forces right ventricular hypertrophy.
Key Equations
| Equation | Variables & When to Use |
|---|---|
| Cardiac output (L/min); HR = beats/min, SV = mL/beat. Fundamental pump output. | |
| Mean arterial pressure; use when given systolic and diastolic. Not a simple average. | |
| Ohm's Law analog; links pump output to vascular resistance. Key for hypertension reasoning. | |
| Pulse pressure; increases with ↑SV or ↓arterial compliance. | |
| Poiseuille's Law; volumetric flow in laminar conditions. Note the dependence. | |
| Vascular resistance; = viscosity, = length, = radius. | |
| Total resistance of vessels in series (e.g., aorta → artery → arteriole in sequence). | |
| Total resistance of vessels in parallel (e.g., multiple organs in systemic circuit). | |
| Continuity equation; = cross-sectional area, = mean velocity. Q conserved in steady state. | |
| Bernoulli's equation; applies at sites of changing diameter (stenosis) or height. Ideal fluid. | |
| Reynolds number; laminar, turbulent. Predicts murmur/bruit formation. | |
| Compliance; veins have high (volume reservoir), arteries have low (pressure reservoir). |