Demography is the scientific study of human populations — their size, structure, and how they change over time. For the MCAT, this topic sits at the intersection of sociology and public health: why populations grow or shrink, how people move across borders, and what happens when those changes accumulate into social movements, globalization, and urban transformation.
Priority labels: Must know = cold; Know the logic = mechanism not names; Passage-level = recognize, don't memorize; Optional = skippable.
Theories of Demographic Change
Malthusian Theory
Must knowThomas Malthus (1798) argued that populations grow geometrically (1 → 2 → 4 → 8) while food grows only arithmetically (1 → 2 → 3 → 4), so populations inevitably outstrip food supply and are held in check by positive checks (famine, disease, war — raise mortality) and preventive checks (delayed marriage, celibacy — lower fertility).
The critique (often tested): Malthus didn't anticipate modern agricultural technology, and population growth actually slows as countries develop — the opposite of his prediction for prosperous societies.
Quick check: A country experiences rapid population growth alongside a stable food supply and rising living standards. Does this support or challenge Malthusian theory?
Answer: It challenges Malthus, because his model predicts food scarcity and positive checks as the inevitable consequence of population growth. The demographic transition model better explains this pattern.
Demographic Transition Model
Must knowThe Demographic Transition Model (DTM) describes the shift in birth and death rates accompanying industrialization — one of the most tested frameworks in this unit.
The core insight: death rates fall before birth rates do, creating a period of rapid population growth in the middle stages. As societies modernize (rising education, falling infant mortality, children becoming an economic cost rather than a labor asset), families choose to have fewer children.
| Stage | Death Rate | Birth Rate | Population Trend | Example |
|---|---|---|---|---|
| 1 – Pre-industrial | High | High | Stable (low) | Historical hunter-gatherer societies |
| 2 – Early industrial | Falling | Still high | Rapid growth | Sub-Saharan Africa today |
| 3 – Late industrial | Low | Falling | Slowing growth | India, Brazil |
| 4 – Post-industrial | Low | Low | Stable (high) | USA, UK |
| 5 – (Some models) | Low | Below replacement | Declining | Japan, Germany |
The natural increase rate = birth rate − death rate; it peaks in Stage 2 and falls toward zero (or below) in Stage 4–5.
Population momentum (tested): even after fertility falls to replacement level, a population can keep growing for decades because a prior high-fertility era left a large young cohort yet to pass through childbearing years. This is why projections must account for the existing pyramid, not just current fertility.
Passage-levelPopulation policies. Pronatalist policies encourage childbearing (parental leave, cash bonuses) in below-replacement Stage 5 countries; antinatalist policies discourage it to slow growth (e.g., China's former one-child policy). Encouraging immigration is another response to demographic decline, adding working-age people.
Quick check: A country has high birth rates, rapidly falling death rates, and booming population growth. Which DTM stage is it in, and what is likely driving the mortality decline?
Answer: Stage 2. Mortality is typically falling because of improved sanitation, vaccines, and basic medical care — not yet economic prosperity or reproductive choice.
Population Growth and Decline
Exponential vs. Logistic Growth
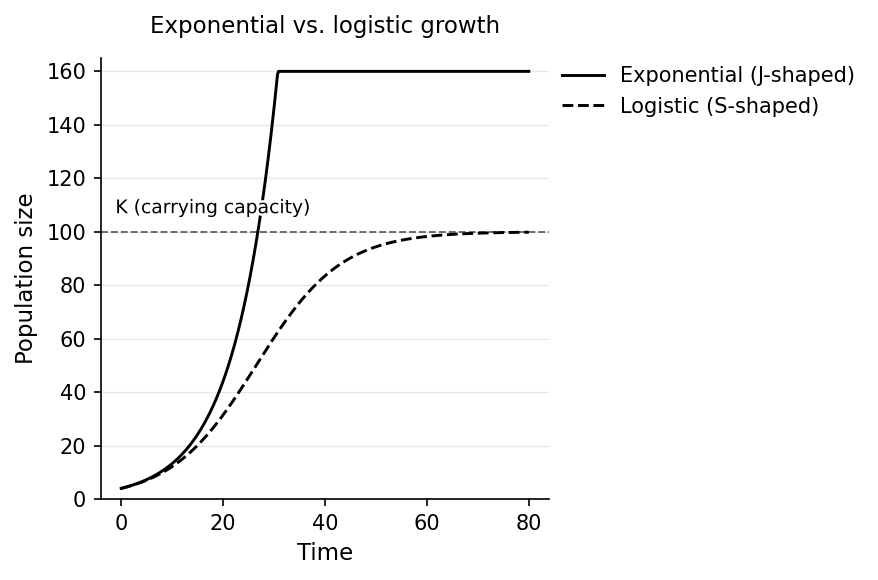
Know the logicExponential growth: constant-rate growth with no resource limits, producing a J-shaped curve (the geometric growth Malthus feared). Logistic growth is more realistic: growth starts exponentially but slows as the population approaches the carrying capacity (K) — the maximum the environment can sustain — producing an S-shaped curve that levels off at K. Real populations bend toward the logistic pattern because resources impose limits.
Quick check: A bacterial population doubles every hour in an unlimited nutrient broth, then plateaus as nutrients are depleted. Which growth model describes the full trajectory?
Answer: Logistic growth. The early unlimited phase is exponential, but the plateau as resources run out reflects approach to carrying capacity — the defining feature of the logistic (S-shaped) curve.
Population Pyramids
Must knowA population pyramid is a back-to-back age-sex bar chart (males one side, females the other, youngest at the bottom). The shape signals demographic stage:
- Expansive (wide base, narrow top): high birth rates, young/growing population. Stage 2.
- Constrictive (narrowing base): younger cohorts are smaller than older ones; aging/declining population. Stage 4–5.
- Stationary (near-uniform width): stable birth and death rates. Stage 4 equilibrium.
The three characteristic shapes are easiest to recognize side by side, as in the figure below.

The MCAT may show a pyramid and ask you to infer trends: a constrictive pyramid signals an aging population, labor shortages, and pension/healthcare pressure; an expansive one signals future large working-age cohorts (a potential demographic dividend) but also resource strain.
The pyramid drives the dependency ratio: dependents (children + elderly, those not in the workforce) divided by the working-age population. It is high for both very young (expansive) and very old (constrictive) age structures.
Population projections forecast future size from current age structure, fertility, and mortality; they are highly sensitive to fertility assumptions, which compound over generations.
Quick check: A population pyramid shows a large bulge in the 15–29 age group with a narrowing above and below. What does this suggest about this society's near-term future?
Answer: A large cohort of young adults is about to enter peak reproductive years, suggesting birth rates may soon rise (an "echo boom"). However, the narrowing base indicates fertility has already been declining, so actual births depend on whether this cohort maintains current low fertility patterns.
Fertility, Migration, and Mortality
Fertility Rates
Must knowThe conceptual distinction (not computation):
- Crude Birth Rate (CBR): live births per 1,000 total population/year. Misleading because it's distorted by age structure — a population with many elderly has a low CBR even if young women are highly fertile.
- Age-Specific Fertility Rate (ASFR): births per 1,000 women in a specific age group; controls for age structure.
- Total Fertility Rate (TFR): average children a woman would have over her reproductive lifespan at current rates. Replacement level ≈ 2.1; TFR > 2.1 → population grows, < 2.1 → shrinks. The TFR is the key fertility statistic because it controls for age structure.
Patterns in fertility: lower with higher female education, female labor-force participation, contraception access, cost of living, and urbanization — which is why Stage 3–4 countries see fertility decline.
Quick check: Country A has a CBR of 35/1,000 but a TFR of 2.4. Country B has a CBR of 12/1,000 but a TFR of 1.8. Which country's population will grow in the long run, and why might the CBR be misleading here?
Answer: Country A's population will grow (TFR > 2.1). Country B's CBR appears low partly because of its age structure — it may have a large elderly population depressing the rate. The TFR correctly controls for this by focusing on women's childbearing behavior.
Mortality Rates
Must know- Crude Death Rate (CDR): deaths per 1,000 total population/year; distorted by age structure (an older population has a higher CDR even with excellent health).
- Age-Specific Mortality Rate (ASMR): deaths per 1,000 in a specific age group; cleaner risk measure.
- Infant Mortality Rate (IMR): deaths under age 1 per 1,000 live births — the single most sensitive indicator of a population's public health (proxy for sanitation, infrastructure, prenatal/postnatal care).
- Life Expectancy: average years a newborn is expected to live at current mortality rates; strongly influenced by IMR.
Patterns in mortality: higher with less healthcare access, lower income, worse sanitation, and more conflict/famine. The epidemiological transition (Omran) describes the shift in causes of death from infectious diseases (Stages 1–2) to chronic/degenerative diseases (Stages 3–4) — closely linked to the DTM.
Quick check: A journalist reports that Country X has a very low crude death rate, lower than many wealthy European nations. Does this mean Country X has better health outcomes?
Answer: Not necessarily. Country X may simply have a very young population (common in Stage 2 countries), which naturally produces low CDRs. Comparing age-specific mortality rates or life expectancy would be more informative.
Push and Pull Factors in Migration
Must knowMigration — movement across a boundary to establish residence — is the third driver of population change. Distinguish immigration (into a country) from emigration (out of). The net migration rate = immigration − emigration per 1,000/year; total population change = natural increase (births − deaths) + net migration, so a below-replacement country can still grow with positive net migration.
Everett Lee's Push-Pull Theory is the canonical framework:
- Push factors: conditions at the origin that repel — poverty, unemployment, persecution, violence, famine.
- Pull factors: conditions at the destination that attract — jobs, safety, freedom, family networks.
- Intervening obstacles: barriers between (distance, immigration laws, cost) that reduce migration even when push/pull are strong.
Migration is selective (skews young, educated, networked — chain migration), which can cause brain drain when a developing country's skilled workers emigrate.
Quick check: A rural farmer moves to the city after her village's farmland becomes unproductive due to drought. A university graduate from the same village independently moves to the city to pursue a tech job. Which is primarily push-driven, which is primarily pull-driven?
Answer: The farmer is primarily push-driven (drought making the village inhospitable). The graduate is primarily pull-driven (economic opportunity in the city). In practice, both factors often coexist, but identifying the dominant force is the MCAT skill.
Social Movements
Must knowA social movement is an organized, sustained collective effort by a group of people to promote or resist social change. Movements are more structured and enduring than spontaneous crowds or fads, and the frameworks below explain why they emerge, how they organize, and which tactics they choose.
Relative Deprivation
Must knowKey insight: movements are not most likely when conditions are at their worst. Relative deprivation is the perception of disadvantage relative to a reference group — not absolute poverty, but the felt gap between what you have and what you believe you deserve or see others having (associated with Stouffer and Merton).
Know the logicJames Davies' J-curve theory extends this: revolutions are most likely when rising expectations (rising prosperity) are followed by a sharp reversal, opening a gap between expected and actual well-being that motivates collective action.
Quick check: A country experiences 20 years of economic growth and rising living standards, then enters a sudden recession. Relative deprivation theory would predict what response from the population?
Answer: The theory predicts heightened social unrest or movement activity, because expectations have been elevated by years of growth. The gap between what people now expect and what they receive is larger than if they had always lived in poverty — this is the J-curve.
Organization of Social Movements
Must knowDeprivation is necessary but not sufficient — movements also need organization and resources. Resource Mobilization Theory (McCarthy & Zald) argues that movements' emergence and success depend on their ability to acquire and deploy resources — money, labor, media, legal expertise, political connections.
Passage-levelStages of development: emergence (grievance, informal networks) → coalescence (organizes, sets goals) → bureaucratization (formal organizations, leadership) → decline (success, co-optation, repression, or fragmentation).
Passage-levelComplementary theories:
- New Social Movement Theory (Habermas, Touraine, Melucci): post-industrial movements organize around identity and culture (civil rights, LGBTQ+, environmentalism, feminism), not purely economic grievances.
- Political Process / political opportunity theory (McAdam): movements succeed when the political opportunity structure opens (elite divisions, expanded access). Grievances + resources aren't enough; context must be favorable.
- Framing theory (Snow/Goffman): movements construct meaning by defining a problem, assigning blame, and motivating action through frames that resonate with cultural values.
Quick check: An environmental group lobbies corporations, runs media campaigns, and secures foundation grants. Which theoretical framework best describes what they are doing to sustain their movement?
Answer: Resource Mobilization Theory — they are acquiring and strategically deploying financial and media resources to advance their cause.
Movement Strategies and Tactics
Know the logicTactics range from institutionalized (within the system: lobbying, litigation, electoral politics — favored by resource-rich, legitimate movements) to non-institutionalized (demonstrations, boycotts, strikes, civil disobedience, sit-ins) to radical/disruptive (sabotage, occupation, riots).
Civil disobedience is nonviolent, deliberate refusal to obey unjust laws, with willing acceptance of punishment (Thoreau, Gandhi, MLK). The choice of tactics reflects a reform (change policies within the system) vs. radical (transform the structure) debate.
Passage-levelAberle's typology classifies movements by who changes (some vs. everyone) and how much (limited vs. radical): alternative (limited change in specific people), redemptive (radical change in specific people), reformative (limited change in society), revolutionary (radical change in all of society).
Quick check: A movement that previously relied solely on peaceful marches begins filing federal lawsuits and running candidates for local office. How would you describe this tactical shift?
Answer: A shift toward institutionalized (within-the-system) tactics, consistent with bureaucratization and growing resource capacity as described by Resource Mobilization Theory.
Globalization
Factors Contributing to Globalization
Know the logicGlobalization is the increasing interconnectedness of economies, cultures, and populations through cross-border exchange of goods, people, ideas, and information.
Key drivers:
- Communication technology: internet and cheap telecom enable real-time global coordination.
- Transportation: container shipping, aviation, and global supply chains cut the cost of moving goods/people.
- Economic interdependence: free trade agreements (NAFTA/USMCA, WTO) reduce tariffs; multinational corporations source and sell across countries.
- Political agreements / migration: international institutions (UN, IMF, World Bank) and the movement of people link countries economically and culturally.
Quick check: A smartphone is designed in California, its chips manufactured in Taiwan, assembled in China, and sold in Brazil — all coordinated via real-time internet. Which two globalization drivers does this most directly illustrate?
Answer: Economic interdependence (global supply chain integrating multiple national economies) and communication technology (enabling real-time coordination across continents).
Perspectives on Globalization
Must knowGlobalization is contested; the key distinction is conflict vs. functionalist:
- World Systems Theory (Wallerstein): divides the global economy into core (wealthy, value-extracting), periphery (poor, raw materials/cheap labor), and semi-periphery. Conflict view: globalization perpetuates inequality.
- Modernization theory (functionalist): globalization transmits development from core to periphery and eventually reduces inequality; optimistic about convergence.
Cultural globalization: McDonaldization (Ritzer) — the spread of efficiency/calculability/predictability/control homogenizing local cultures; cultural imperialism — powerful nations imposing their culture on weaker ones.
Quick check: A sociologist argues that global trade has benefited wealthy nations by giving them access to cheap labor while keeping poor nations dependent on commodity exports. Which perspective is this?
Answer: World Systems Theory (Wallerstein) — framing globalization as a structure that reproduces core-periphery inequality.
Social Changes in Globalization
Know the logicGlobalization produces social disruption:
- Civil unrest: inequality from outsourcing/austerity fuels domestic conflict and anti-globalization protests.
- Terrorism: interconnectedness lets extremist ideologies and networks cross borders.
- Cultural hybridization: rather than pure homogenization, local cultures often absorb and blend global influences.
- Labor exploitation: manufacturing moving to low-wage countries raises labor-rights and race-to-the-bottom concerns.
Quick check: A community's traditional textile industry collapses after cheap imports flood the market following a trade agreement, and youth unemployment rises sharply. Applying a globalization perspective, what social consequences might follow?
Answer: Economic displacement and relative deprivation could fuel civil unrest, social movement activity, or political radicalization — consistent with patterns seen in deindustrialized communities worldwide.
Urbanization
Industrialization and Urban Growth
Must knowUrbanization is the rising proportion of a population living in cities, linked to industrialization: factories need concentrated labor, and agricultural mechanization frees (or displaces) rural workers to migrate cityward.
Urban sociologists developed ecological models of city structure. The MCAT most often references the Concentric Zone Model (Burgess, Chicago School): cities grow outward in rings from the central business district, with a transition zone (factories, poor housing) just outside the CBD where new immigrants and the poorest residents live — relevant to health disparities.
OptionalSector Model (Hoyt) — growth in wedges along transport routes; Multiple Nuclei Model (Harris & Ullman) — multiple activity centers, not one core.
Quick check: A hospital administrator notes that a city's poorest neighborhoods — where rates of preventable disease are highest — are clustered just outside the downtown business district, not on the outskirts. Which urban model does this pattern best fit?
Answer: The Concentric Zone Model — the transition zone adjacent to the CBD is characterized by poverty and social disorganization, consistent with Burgess's framework.
Suburbanization and Urban Decline
Must knowPost-WWII suburbanization (especially in the US) was driven by highway construction, federal mortgage subsidies (GI Bill, FHA — accessible mainly to white families), white flight (white/middle-class migration to suburbs away from racially diversifying cities), and manufacturing relocation. Redlining — discriminatory denial of mortgages/insurance to minority neighborhoods — trapped Black and other minority families in declining urban cores.
The result was urban decline: lost tax base → reduced services, deteriorating infrastructure, concentrated poverty, and urban blight (abandoned buildings, high vacancy). Deindustrialization (manufacturing moving overseas or automating) compounded this in Rust Belt cities.
Quick check: A city's school district budget collapses just as poverty rates in the urban core rise. A sociologist connects this to the post-WWII era. What process best explains this fiscal–poverty dynamic?
Answer: Suburbanization and white flight removed middle-class tax base from the city while concentrating poverty in the urban core, creating a fiscal trap where the most need coincides with the least resources.
Gentrification and Urban Renewal
Must knowGentrification is the influx of higher-income residents into lower-income, often minority urban neighborhoods, raising property values and displacing existing residents who can no longer afford rising rents — disproportionately communities of color. It is driven by attractive urban property values, professionals seeking walkable neighborhoods, and developer/municipal investment. Consequences are contested: it improves infrastructure and tax revenue but causes displacement, the major social-justice concern. (Term coined by Ruth Glass.)
Urban renewal is the related, often government-directed demolition and redevelopment of blighted areas; historic US programs were criticized for destroying Black neighborhoods. The key distinction: gentrification is market-driven (private investment); urban renewal is policy-driven (government). Both raise displacement concerns.
Quick check: A neighborhood previously home to working-class Latino families sees a wave of young white professionals move in, rents triple in five years, and many original residents relocate to other cities. This is an example of which phenomenon, and what is its primary social harm?
Answer: Gentrification. The primary social harm is displacement — the involuntary relocation of existing residents unable to afford rising housing costs, which disrupts communities, social networks, and access to familiar services.
Common Confusions & Tricks
CBR vs. TFR: Students often use these interchangeably. Remember: the CBR is distorted by age structure and can give a misleading picture. The TFR is the "true" measure of reproductive behavior because it's age-standardized. If the MCAT gives you a country with a young population, its CBR will be artificially high even if women are having fewer kids than a decade ago.
Relative deprivation ≠ absolute poverty: The whole point of this theory is that revolution comes from comparison, not from rock-bottom conditions. The most oppressed groups are not always the most rebellious — it is those whose expectations have risen who feel the gap most acutely. Don't confuse this with structural poverty.
Push vs. pull: Push factors drive you away from a place; pull factors draw you toward a destination. A helpful mnemonic: "Push = Problem at home; Pull = Promised land ahead."
Resource Mobilization vs. Relative Deprivation as movement explanations: These are complementary, not competing theories. Relative deprivation explains the grievance (why people are angry); resource mobilization explains the capacity (why the movement succeeds or fails). A movement needs both — grievance without organization goes nowhere.
Gentrification vs. urban renewal: Gentrification = market-driven, private investment; urban renewal = government-directed policy. Both cause displacement, but the mechanism and actor are different. The MCAT may ask you to classify a scenario.
Malthus vs. DTM: Malthus predicted rising prosperity → more babies → eventual catastrophe. The DTM shows rising prosperity → fewer babies, the opposite. When a passage discusses a country developing economically with falling fertility, that's a DTM story, not a Malthusian one.
Wallerstein vs. modernization theory: Both address global inequality, but Wallerstein (World Systems Theory) says globalization perpetuates inequality (core exploits periphery); modernization theory says globalization reduces inequality (by transferring technology and institutions). Know which is the conflict perspective and which is the functionalist one.
Concentric Zone Model ≠ author Hoyt: The Concentric Zone Model belongs to Ernest Burgess (Chicago School). Homer Hoyt developed the Sector Model. This is a common mix-up on MCAT passages.
Demographic dividend: When a country transitions from high to lower fertility, there is a temporary "sweet spot" when the working-age population is large relative to dependents (children and elderly). This can fuel economic growth — but only if institutions support education and employment. It is NOT an automatic guarantee of prosperity.
Key Theories & Terms
| Term / Theory / Person | What It Means / Who |
|---|---|
| Malthus, Thomas | 18th-century economist who argued population grows geometrically while food grows arithmetically, predicting inevitable famine and misery as population checks |
| Positive checks (Malthus) | Events that raise mortality to control population — famine, disease, war |
| Preventive checks (Malthus) | Behaviors that lower fertility to avoid crisis — delayed marriage, celibacy |
| Demographic Transition Model (DTM) | Four-stage model describing how death rates then birth rates fall as societies industrialize, producing a period of rapid population growth in between |
| Natural increase rate | Birth rate minus death rate; the net rate of population change excluding migration |
| Population momentum | Continued population growth after fertility falls to replacement level, driven by a large young cohort from a prior high-fertility era |
| Dependency ratio | Ratio of dependents (children + elderly) to the working-age population; high in both very young and very old age structures |
| Exponential vs. logistic growth | Exponential = constant-rate J-shaped growth with no limits; logistic = S-shaped growth that levels off at carrying capacity (K) |
| Net migration rate | Immigration minus emigration per 1,000 people; combined with natural increase to give total population change |
| Pronatalist / antinatalist policies | Government policies encouraging (pronatalist) or discouraging (antinatalist) childbearing to address demographic decline or rapid growth |
| Political Process Theory | McAdam; movements succeed when the political opportunity structure opens (elite divisions, expanded access), beyond grievances and resources |
| Aberle's typology | Classifies movements by scope/target: alternative, redemptive, reformative, revolutionary |
| Epidemiological transition (Omran) | Shift in leading causes of death from infectious diseases to chronic/degenerative diseases as societies develop |
| Population pyramid | Age-sex bar chart revealing a population's age structure; shapes (expansive, constrictive, stationary) signal demographic stage |
| Crude Birth/Death Rate (CBR/CDR) | Births or deaths per 1,000 total population; distorted by age structure |
| Total Fertility Rate (TFR) | Average children per woman over her lifetime at current fertility rates; replacement level ≈ 2.1 |
| Infant Mortality Rate (IMR) | Deaths under age 1 per 1,000 live births; the most sensitive index of a population's public health |
| Age-Specific Rates | Fertility or mortality rates calculated for a specific age group, controlling for population age structure |
| Lee's Push-Pull Theory | Everett Lee's framework explaining migration via forces repelling from origin (push), attracting to destination (pull), and barriers in between (intervening obstacles) |
| Chain migration | New migrants following established social networks to the same destination |
| Brain drain | Emigration of highly educated or skilled individuals from developing countries |
| Social movement | An organized, sustained collective effort to promote or resist social change |
| Relative deprivation | Perceived disadvantage relative to a reference group; key motivation for social movement participation; associated with Stouffer and Merton |
| J-curve theory (Davies) | Revolutions most likely when rising expectations are followed by sudden reversal, creating a gap between expected and actual well-being |
| Resource Mobilization Theory | McCarthy and Zald; social movements succeed based on their ability to acquire and deploy resources (money, labor, media) |
| New Social Movement Theory | European framework (Habermas, Touraine, Melucci) emphasizing identity and cultural recognition as movement goals, beyond economic interests |
| Framing theory (Snow/Goffman) | Social movements construct meaning by defining problems, assigning blame, and motivating action through resonant cultural frames |
| Civil disobedience | Nonviolent, deliberate law-breaking to protest injustice, with willingness to accept legal consequences; associated with Thoreau, Gandhi, MLK |
| Globalization | Increasing economic, cultural, and social interconnectedness across national borders |
| World Systems Theory (Wallerstein) | Conflict perspective dividing the global economy into core (wealthy), semi-periphery, and periphery (poor) nations; globalization perpetuates inequality |
| Modernization theory | Functionalist perspective viewing globalization as transmitting development and eventually reducing global inequality |
| McDonaldization (Ritzer) | Spread of rationalized, standardized, efficiency-driven Western culture globally; a form of cultural imperialism |
| Concentric Zone Model (Burgess) | Chicago School model of city structure as rings from CBD outward; transition zone adjacent to CBD has poorest residents |
| Sector Model (Hoyt) | Cities grow in wedge-shaped sectors along transportation routes, not uniform rings |
| Multiple Nuclei Model (Harris & Ullman) | Cities organized around multiple activity centers, not one central core |
| Suburbanization | Post-WWII movement of middle-class (often white) residents to suburbs, enabled by highways and federal mortgage policy |
| White flight | Racially motivated migration of white residents from urban cores to suburbs in response to racial integration |
| Redlining | Discriminatory denial of mortgages/insurance to residents of minority neighborhoods, trapping them in declining urban areas |
| Urban decline / blight | Deterioration of urban infrastructure, tax base, and services following suburbanization and deindustrialization |
| Gentrification | Market-driven influx of higher-income residents into low-income urban neighborhoods, raising property values and displacing existing residents; coined by Ruth Glass |
| Urban renewal | Government-directed demolition and redevelopment of blighted urban areas; historically associated with displacement of minority communities |
| Demographic dividend | Economic growth potential from a temporarily large working-age population during demographic transition, before aging begins |